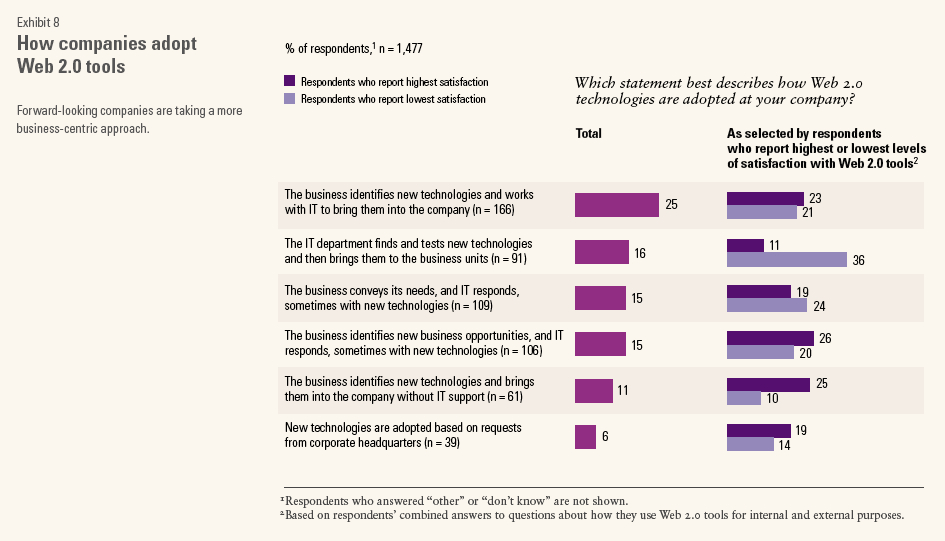
In the McKinsey report on Web 2.0 in the Enterprise from 2008, Exhibit 8 reports on how companies adopt Web 2.0 tools.
(Click for a larger image)
My Comments
1. Look at the satisfaction levels on the right-hand side of the image first. Here’s what I noticed: In every case, SATISFACTION is HIGHER and DISSATISFACTION is LOWER if the business had some involvement in early process of adoption, compared to the second line approach of “The IT department finds and tests new technologies and then brings them to the business units.” In every case!!
2. I believe there’s a word for IT dominated approaches then – a worst practice. You gotta love data!
Categories: Culture & Competency

Hi Michael,
The link to the enlarged image is broken. It appears to be incomplete, as all I had to do was append a “g” to make the “jpg” extension complete and voila!
Thanks for the data too!
FIXED! Thanks for pointing that out Bruce – much appreciated.
Michael.
Thanks for sharing this Michael… very interesting stats!
Karen
Thanks for sharing this Michael…
Very powerful stats!
Karen